Shipping OSSEC alerts to Loki with Grafana Alloy
OSSEC has been able to write its alerts as JSON since version 2.9. That one line of configuration is enough to hand them to Grafana Alloy, which can label, timestamp, and metric them on the way into Loki.
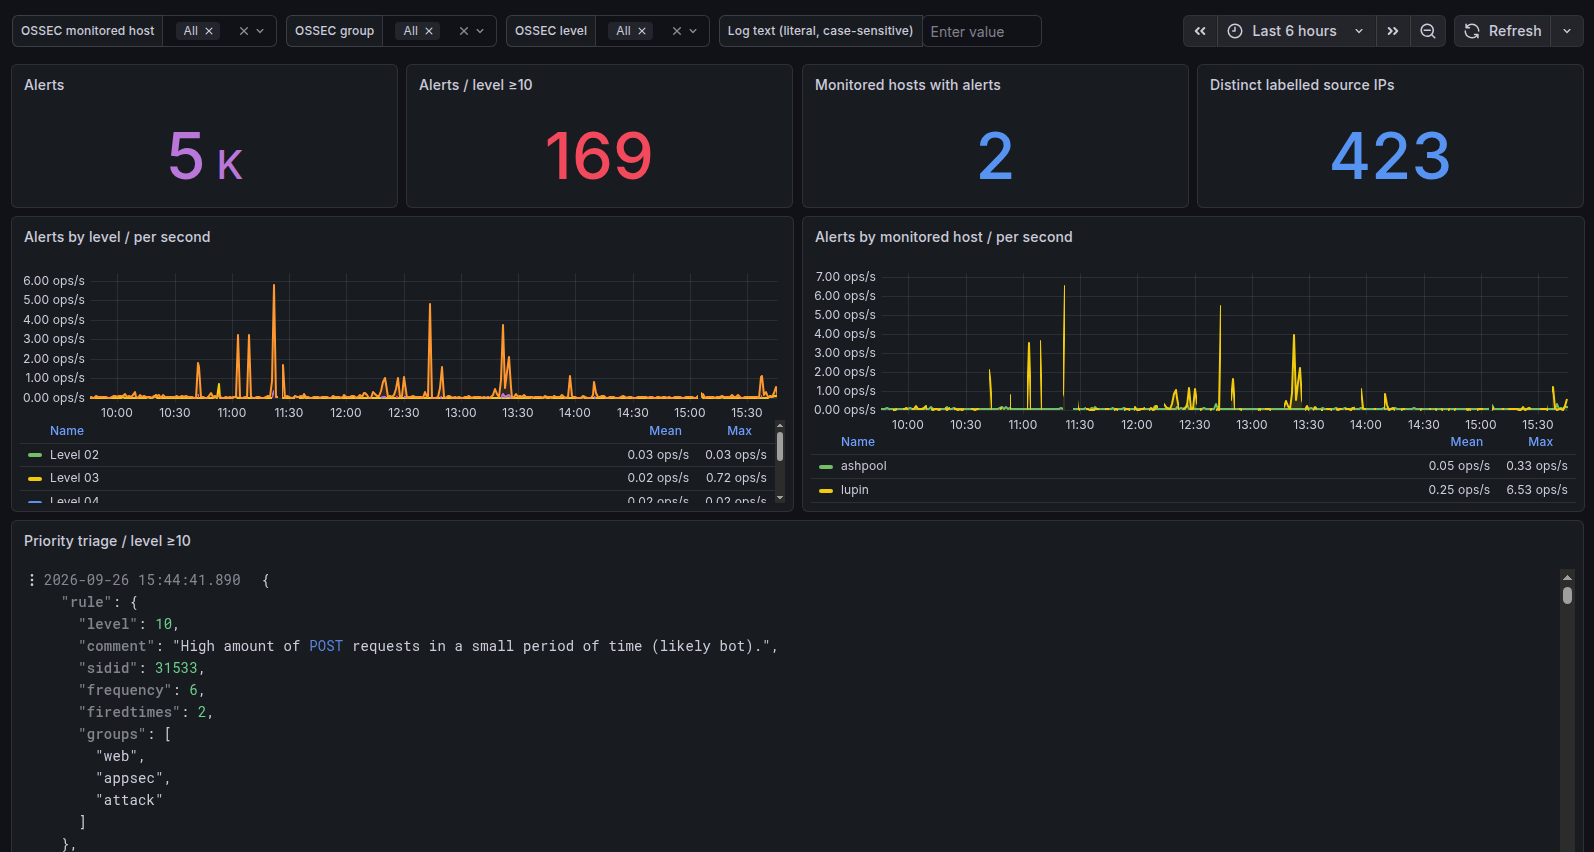
Getting OSSEC logs into Loki? How?
Let's say you run OSSEC as a host IDS - file integrity checking, rootkit detection, log-based rules, active responses - and you already operate a Grafana Loki stack.
The alerts live on disk in /var/ossec/logs/alerts/, rotating and compressing daily.
What you want is for those same alerts to appear in Loki, queryable alongside your application and system logs, labelled by the things you actually want to filter by, such as the rule level, the rule group, the host that produced the alert, or the source IP.
Grafana Alloy is what ships logs to Loki. Already popular for syslogs and other types of log format, it can tails the JSON file that OSSEC emits, parse each line, promote chosen fields to labels, and send them on to Loki.
All it takes on OSSEC's side is a one-line change in ossec.conf to create on the JSON output that
Alloy reads from.
Why ship OSSEC alerts to Loki?
OSSEC's local alerts.log and alerts.json are rotated and checksummed daily, and they live
on the OSSEC manager itself. That's fine for forensics on that host, but it's an awkward place
to look when you're correlating a security event with what the application, the firewall, and
the web server were doing at the same time.
Loki gives those alerts a single query plane with everything else. Once the alerts are labelled
and in Loki, a LogQL query like {system="ossec", level=~"0[7-9]|1[0-5]"} shows every alert at
level 7 and above across every host you ship from.
The same query can feed a Grafana dashboard panel, a Grafana alerting rule, or a one-off investigation in Grafana's Explore pane.
Retention is cheap, because Loki is really index-light (and aside from speed, is another reason I prefer it over Elasticsearch): it indexes the labels, keeps the log lines compressed, and leaves the full alert text for you to expand when you need it.
There's also a free metric that comes out of this pipeline. Alloy can count alerts as they pass
through and export a counter on its own /metrics endpoint, so you get an ossec_alerts_total
series to alert on - "alert rate above threshold for this host" - without standing up a
separate monitoring path for security events.
Native OSSEC alongside Loki
OSSEC is a lightweight, single-process daemon. Its rule set, decoders, file integrity engine, and active responses are enough on their own for a host that needs local detection and response. For a site already standardised on the Grafana stack - Loki for logs, perhaps Prometheus for metrics, Grafana for dashboards and alerting - pointing OSSEC's JSON output into Loki keeps security events in the same observability plane as everything else. One query language, one dashboarding tool, one alerting layer. The OSSEC manager keeps doing detection; Loki keeps the history; Grafana keeps your eyes on it all.
Turning on JSON output in OSSEC
OSSEC has been able to write JSON-formatted alerts since version 2.9. The output lands at
/var/ossec/logs/alerts/alerts.json, side by side with the legacy alerts.log. The legacy
file is unaffected, and the daily rotation and checksumming applies to both.
The switch is a single element in the <global> block of
/var/ossec/etc/ossec.conf:
<ossec_config>
  <global>
    <jsonout_output>yes</jsonout_output>
    <!-- ...your other global settings... -->
  </global>
</ossec_config>
Restart OSSEC and confirm the file is being written to:
sudo systemctl restart ossec
tail -n 1 /var/ossec/logs/alerts/alerts.json | jq .
Each line is one JSON object. The classic OSSEC format - the one this pipeline is written against - looks like:
{"rule":{"level":5,"comment":"Syslogd restarted.","sidid":1005,"group":"syslog,errors,"},"id":"1510376401.0","TimeStamp":1510376401000,"location":"/var/log/messages","full_log":"Nov 11 00:00:01 ix syslogd[72090]: restart","hostname":"ix","program_name":"syslogd"}
The fields this pipeline reads are:
TimeStamp- when OSSEC processed the event.rule.level- the rule's severity, 0 to 15.rule.group- the comma-separated rule groups (singulargroup, a string, in this format).hostname- the agent or manager name. This can be a bare hostname, or a parenthesised form like(junction) 192.168.17.17->/var/log/maillogwhen OSSEC records the agent and the log path together. The pipeline handles both.srcip- the source IP, when the rule extracted one.
The Alloy pipeline
The config below tails alerts.json, runs it through a processing pipeline, and writes the
result to Loki. I'll walk through what each stage does and why.
loki.write "loki" {
  endpoint {
    url = "https://loki.example.net/loki/api/v1/push"

    basic_auth {
      username = "someuser"
      password = "some-pass"
    }
  }
  external_labels = {}
}

loki.source.file "ossec_alerts" {
  targets = [
    {
      __path__    = "/var/ossec/logs/alerts/alerts.json",
      __address__ = "localhost",
      system      = "ossec",
    },
  ]

  forward_to = [loki.process.ossec_alerts.receiver]
}

loki.process "ossec_alerts" {
  stage.json {
    expressions = {
      timestamp   = "TimeStamp",
      level       = "rule.level",
      ossec_group = "rule.group",
      ossec_host  = "hostname",
      ip          = "srcip",
    }
  }

  // This strips parentheses from ossec_host by overwriting it with the capture group.
  stage.regex {
    source     = "ossec_host"
    expression = "^\\((?P<ossec_host>\\S+)\\)"
  }

  // Pad level so sorting works as intended
  stage.template {
    source   = "level"
    template = "{{ printf \"%02s\" .Value }}"
  }

  // Promote extracted fields to labels
  stage.labels {
    values = {
      level       = "",
      ossec_group = "",
      ossec_host  = "",
      ip          = "",
    }
  }

  // Use the parsed timestamp as the log entry timestamp
  stage.timestamp {
    source = "timestamp"
    format = "RFC3339"
  }

  // Export a counter metric (exposed on Alloy's /metrics endpoint)
  stage.metrics {
    metric.counter {
      name        = "ossec_alerts_total"
      description = "count of alerts"
      action      = "inc"
      source      = "level"
      prefix      = "" // default prefix would otherwise be added
    }
  }

  // send processed logs onward
  forward_to = [loki.write.loki.receiver]
}
Reading the file
loki.source.file tails /var/ossec/logs/alerts/alerts.json. The system = "ossec" key on
the target becomes a label on every line that comes through it, so even before the processing
pipeline runs, the log stream already carries system="ossec". If you tail other files through
their own loki.source.file blocks, the system label is what keeps them apart in Loki.
Parsing the JSON line
stage.json extracts five fields from each line into the pipeline's extracted map:
TimeStamp becomes timestamp, rule.level becomes level, rule.group becomes
ossec_group, hostname becomes ossec_host, and srcip becomes ip. At this point they're
in the pipeline, but they're not labels yet.
Normalising the hostname
The hostname field isn't always a clean hostname. When OSSEC records the agent alongside the
log path, it looks like (junction) 192.168.17.17->/var/log/maillog. As a label value that's
noisy and high-cardinality, which reduces the performance benefits you otherwise aim for in Loki:
the IP and path make every value nearly unique. The stage.regex strips it back to just the agent
name: the expression ^\((?P<ossec_host>\S+)\) matches a leading parenthesised token and, by
naming the capture group ossec_host, overwrites the extracted value with just junction.
Lines whose hostname is already a bare hostname are left untouched, because the regex simply
doesn't match, and the value passes through.
Padding the rule level
OSSEC rule levels run from 0 to 15. As a label value they're strings, so lexicographic sorting
puts 11 before 3 - which makes a mess of dropdowns and ordered queries. The stage.template
pads the level to two characters with {{ printf "%02s" .Value }}, so 3 becomes 03 and
sorting works as you'd expect. The padding happens before the stage.labels promotes the value
to a label, so Loki only ever sees the padded form.
Promoting to labels
stage.labels takes four of the extracted values - level, ossec_group, ossec_host, and
ip - and turns them into Loki labels. From this point on, every alert line in Loki is
labelled with its rule level, its rule group, its host, and (when the rule extracted one) its
source IP. Combined with the system="ossec" label from the source block, that's the shape of
the log stream in Loki.
Setting the entry timestamp
stage.timestamp uses the parsed TimeStamp as the log entry's time in Loki, so the alert
appears at the moment OSSEC processed it - rather than at the moment Alloy ingested it. The format
here is RFC3339. The TimeStamp field's format varies across OSSEC versions: some emit a
Unix epoch integer (for which UnixMs is the right format), others an ISO 8601 string. If the
stage can't parse the value, Loki falls back to ingestion time and the lines still arrive - so
it's worth confirming in Grafana that the entry timestamps line up with the alert times in
alerts.json rather than the ingestion time. A quick tail of alerts.json next to the same
moment in Grafana's Explore view will tell you.
Exporting an alert counter
stage.metrics increments a counter named ossec_alerts_total for every alert that passes
through, labelled by level. The counter is exposed on Alloy's own /metrics endpoint, so if
Alloy is already scraped by Mimir or Prometheus, you have an alert-rate series for free. The
prefix = "" stops Alloy from prepending its default metric prefix, so the series is
ossec_alerts_total{level="07", ...} and not something longer. A Grafana alerting rule on
rate(ossec_alerts_total[5m]) is the natural "alert burst" detector.
Verifying it in Grafana
Once Alloy is running and OSSEC is writing JSON, open Grafana's Explore, pick the Loki datasource, and start with the stream:
{system="ossec"}
You should see alert lines flowing in. From there, the labels let you narrow down:
{system="ossec", level=~"0[7-9]|1[0-5]"}
{system="ossec", ossec_host="web-01", ossec_group=~".*sshd.*"}
{system="ossec", ip="203.0.113.42"}
The first shows every alert at level 7 and above. The second shows SSH-related alerts from a specific host. The third shows every alert attributed to a given source IP, across all hosts and all rule groups - which is often the fastest way to follow one actor across a fleet.
If you've added the counter metric and you're scraping it, a panel with
sum by (ossec_host) (rate(ossec_alerts_total[5m])) shows the alert rate per host, and a
Grafana alerting rule on the same query is how you get paged on a burst.
Taking it further with GeoIP
With the MaxMind GeoIP database or similar, it's super easy to integrate with Alloy and thereby get your OSSEC attacker IP addresses represented geographically in Grafana as well!
Assuming you've installed geoip-database and configured it with a license in
/etc/GeoIP.conf, and all is well with that db, add this to the ossec_alerts
section of your Alloy config. I used the 'city' database.
stage.geoip {
  db      = "/var/lib/GeoIP/GeoLite2-City.mmdb"
  source  = "ip"
  db_type = "city"
}

stage.labels {
  values = {
    geoip_location_latitude  = "",
    geoip_location_longitude = "",
  }
}

stage.label_drop {
  values = [
    "geoip_postal_code",
    "geoip_subdivision_code",
    "geoip_continent_code",
    "geoip_timezone",
  ]
}
We're dropping some less useful labels there to reduce cardinality in Loki and keep things performing well.
In Grafana, the Geomap plugin is easy to add to a dashboard. Consider a LogQL query like this:
{system="ossec"}
| json url="url", comment="rule.comment"
| url != ""
| geoip_location_latitude != ""
| geoip_location_longitude != ""
(Make sure to also set a Transformation to turn those latitude/longitude fields into Numbers).
Then select Geomap's Location Mode to 'Coords', and geoip_location_latitude / geoip_location_longitude
as the Latitude/Longitude fields in Geomap.
{system="ossec", level=~"0[7-9]|1[0-5]"}- level 7 and above{system="ossec", ossec_host="web-01"}- one host{system="ossec", ip="203.0.113.42"}- one source IP across all hostssum by (ossec_host) (rate(ossec_alerts_total[5m]))- alert rate per host