SQLite batch inserts: wrapping transactions for a 94% performance win
How wrapping batch SQL inserts in a single transaction transformed a 7-second operation into a 0.4-second one, and why measuring the change mattered as much as the fix itself.
The problem: each insert is its own transaction
SQLite is different from database systems like MySQL or PostgreSQL. The database is a file on a filesystem, not a long-running daemon managing connection pools. Locking relies on the underlying filesystem, and every operation that writes to the database acquires a lock on the file.
This matters because in SQLite, every individual SQL statement that modifies data implicitly starts its own transaction. That transaction is committed (or rolled back) immediately after the statement completes. For a single insert this is fine - it ensures ACID compliance and lets SQLite roll back if something goes wrong. But when you are inserting many rows in one request, each insert becomes a full round trip: open the file, obtain a lock, write the data, flush filesystem caches, release the lock. Repeat for every row.
If your application also writes metadata - an audit log entry, a timestamp, a related record - alongside each data insert, you are doing two or more transactions per row. It adds up fast! Especially if your SQLite database is on an NFS filesystem like Amazon's EFS (and yes, SQLite does run on EFS. Just don't use WAL mode).
Measuring the baseline
Before changing anything, it was important to measure the problem. HTTP response time was the right metric here, because it directly reflected what the caller experienced. The graph below shows the response time for batch insert requests before any optimisation was applied:
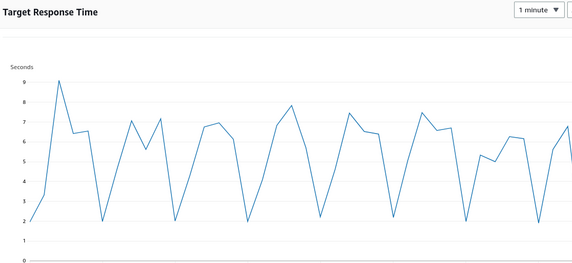
Requests were taking around 7 seconds to complete, sometimes up to 9. On a platform serving many concurrent requests, this was simply unacceptable - not just for the caller waiting on the response, but because each slow request held a write lock that blocked other operations from proceeding.
The fix: one transaction for the whole batch
The solution is to explicitly wrap all the inserts in a single transaction.
Without an explicit BEGIN, SQLite starts an implicit transaction at the first
INSERT and commits it immediately after - meaning one lock acquisition and one
flush per row. By opening the transaction manually before the loop and committing
it once at the end, you collapse N lock acquisitions and N flushes down to one
of each.
The pseudocode, with uninteresting bits omitted:
try {
    $this->dbo->exec("BEGIN IMMEDIATE TRANSACTION");
    foreach ($payload as $row) {
        $this->dbo->exec("INSERT INTO [....]");
    }
    $this->dbo->exec("COMMIT");
} catch Exception {
    $this->dbo->exec("ROLLBACK");
}
Why BEGIN IMMEDIATE and not just BEGIN? A plain BEGIN starts a read
transaction that upgrades to a write lock when the first INSERT is encountered.
If another connection has already acquired a write lock by that point, your
transaction fails with SQLITE_BUSY at the INSERT - after you have already done
some work. BEGIN IMMEDIATE acquires the write lock up front, so you either get
the lock immediately or learn right away that the database is busy and can code
around it (retry, back off, or return a meaningful response to the client).
Measuring the result
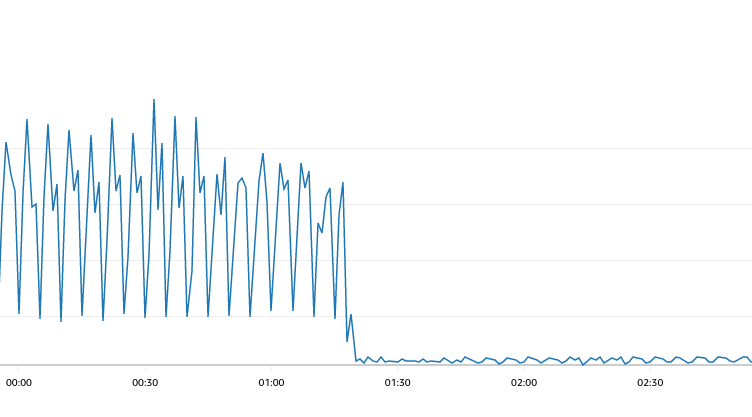
The graph below shows the same HTTP response time metric, with the deployment of the fix visible as a dramatic drop:
Crunching the numbers:
- Previous average response time: ~8 seconds (range 7-9s)
- Post-fix average response time: ~0.44 seconds (range 0.38-0.5s)
- Speedup: (8 - 0.44) / 8 = 0.945, or roughly 94.5%
Three lines of code - BEGIN IMMEDIATE TRANSACTION before the loop, COMMIT
after it, and ROLLBACK in the exception handler - produced a 94.5% improvement.
Why monitoring mattered
The fix itself was simple. The harder part was knowing it was needed.
Without the baseline measurement, there was no way to know whether the slowness was in the database layer, the network, the application logic, or somewhere else entirely. Without the post-deployment measurement, there was no way to confirm the fix actually worked in production, or to quantify how much it helped.
This is the pattern that matters: measure, change, measure again. A 94.5% improvement is dramatic enough that it would have been obvious from the user experience alone, but most performance changes are not. Most are 15% or 20%, and without before-and-after data you are guessing at whether you helped, hurt, or did nothing at all.
Graph the metric that matters to the caller - response time, throughput, error rate - and keep it visible. The graph is what tells you the problem exists in the first place, and it is what tells you the fix is real.
- SQLite implicitly starts & commits a transaction per statement
- Each insert is a full lock-acquire, flush, & lock-release round trip
BEGIN IMMEDIATE TRANSACTIONbefore a batch loop collapses N round trips to oneROLLBACKon failure gives atomicity: the whole batch succeeds or none do